OECD Simple Charts
A lightweight chartingtool. Visit the docs or checkout the code.
Usage
To get started, you can either install the library using npm
npm install oecd-simple-chartsor embed the bundle.min.js and bundle.min.css files, either downloading them from the repository or directly embedding them from a CDN service like unpkg or jsDelivr.
<script src="https://unpkg.com/oecd-simple-charts/build/oecd-simple-charts.min.js"></script>
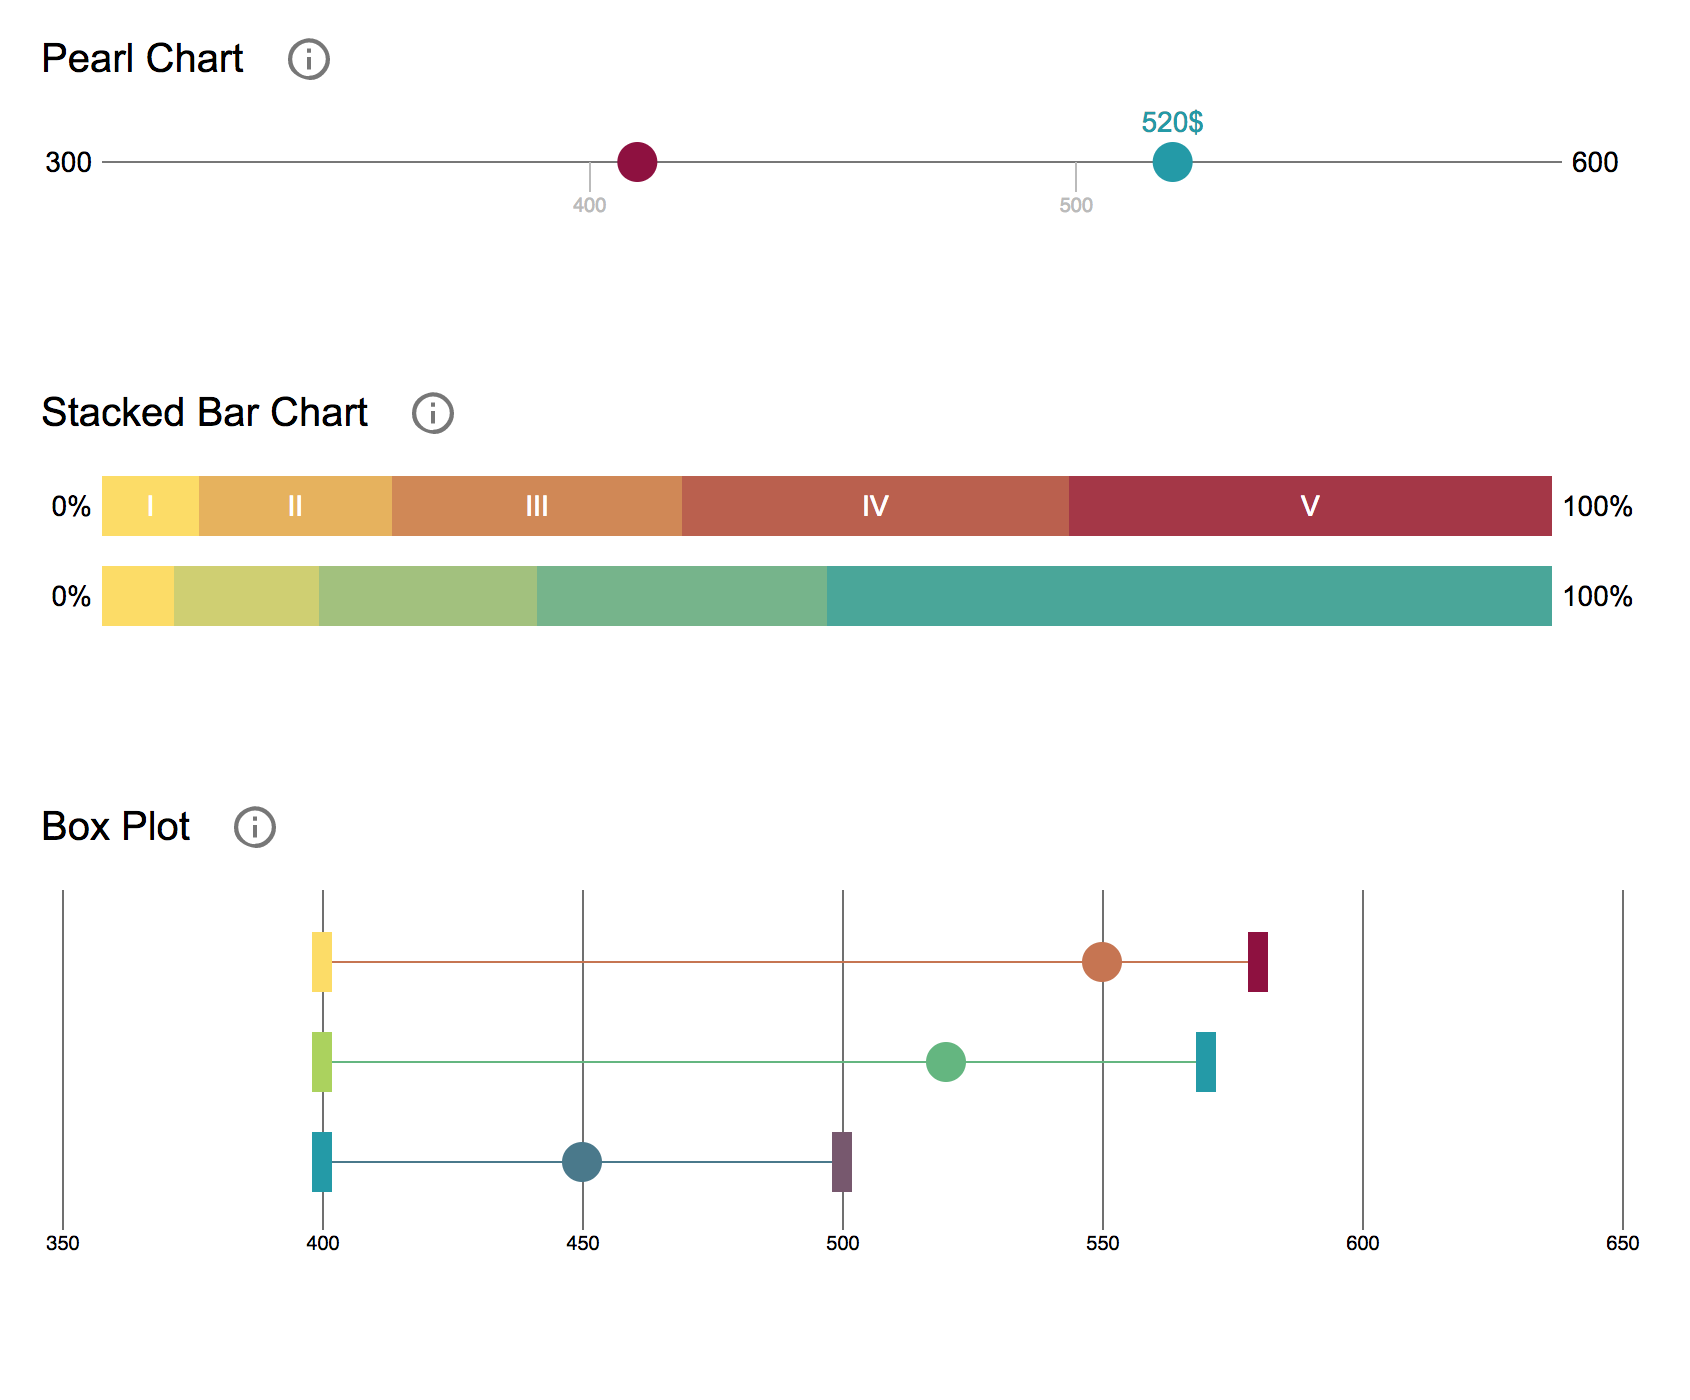
<link href="https://unpkg.com/oecd-simple-charts/build/oecd-simple-charts.min.css" rel="stylesheet">In order to create a chart you need to add a container DOM node. Then you can start with the configuration of the chart. You can set a title, change the size and color of the elements and add data points. Each chart has an update function, that takes an array of new data and updates the visualization.
Development
Clone the repository, install the dependencies, builds the application and starts a webserver with hot loading on localhost:3000:
$ git clone https://github.com/oecd-cyc/oecd-simple-charts.git
$ cd oecd-simple-charts
$ npm install
$ npm start
Build
Builds a minified version of the library in the build/ folder.
$ npm run buildTesting
Run the functional test-suite located in test/:
$ npm testTo run the visual-regression tests, you will first need a running webserver on port 3000 (see Development). Then you can start the tests running:
$ npm run test:visualIf the test fails, but you want to keep your changes run:
$ npm run test:visual:referenceThis will save new screenshots in the screenshots/ folder and these will be used as reference to be tested against the next time you run the tests.
Update documentation
In order to generate the docs, run:
$ npm run docs